
About the Client
The client is a largest NBFC in Indian Financial master. They offer a wide range of secured and unsecured loans to our customers. have more than 1300 Branches spread across 24 States & 3 Union Territories. They provide around 20+ product to the customers in financial domain.
Project Overview
The project revolves around providing analytical insight to the clients where they take actionable
Step to bridge the same. We also provide the YTD, MTD, Branch Profitability report, MIS Expenses,
Team Strength
The team consisted a team of Delivery head, Project manager, SQL developers, Data Analysts and Data scientists.
Key results
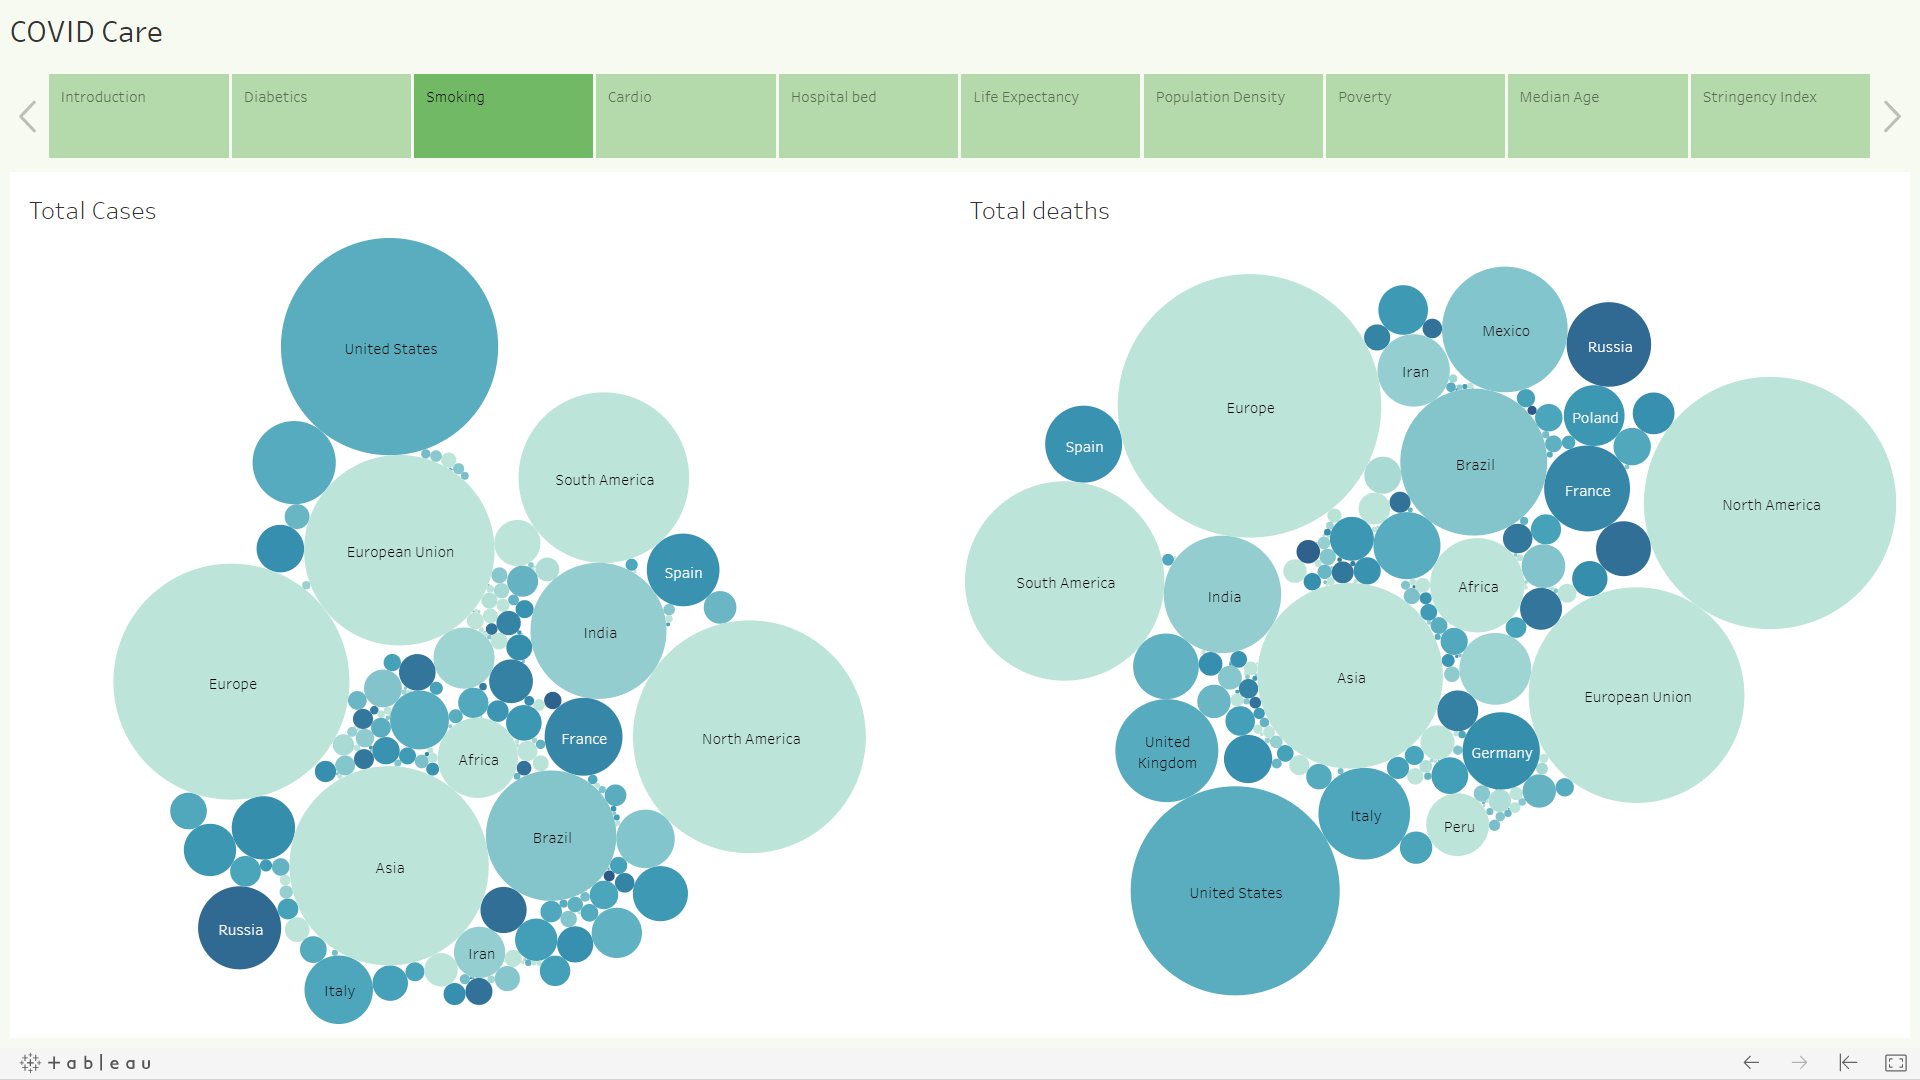
- Overall understanding of Banks growth & Defects.
- Branch profitability analysis presenting top and bottom branches.
- YTD sales with head count.
- Most expensive branches & most profitable branches.
About the Client
- One of India’s largest road developers as measured by lane kilometres under Concession Agreements signed with the Central and State Government authorities.
- The Trust’s initial portfolio of assets comprised of five toll road projects in the Indian states of Rajasthan, Karnataka, Tamil Nadu and Telangana. Subsequently, the Trust added another eight road assets in the states of Rajasthan, Karnataka, Telangana and Maharashtra. Out of these eight projects, six are NHAI projects and two are state projects. These toll roads are operated and maintained pursuant to the concessions granted by the NHAI / State authorities.
Project Overview
- The project is to facilitate development of an Analytical system which consists of extracting Toll transaction data from 11 Toll Plazas & Acquiring bank feeds, processing and transforming to a common reporting structure, developing reports and dashboards, maintaining, and stabilizing the system after development.
- These data to be created as different logical Data marts for relevant reports and analysis models.
- Around 30 set of standard dashboards, and 5 Dashboards & Reports for Big Data Analysis covering Traffic-Plaza cohort analysis.
- Availability of Adhoc report generation facility for the supervisors and business owners
- 90% of the reports shall load in less than 5 seconds, heavy reports fetching several thousand / lakhs of records shall also be processed in reasonable time. Most Dashboards shall load within 5 seconds
Approach
Approach was taken towards addressing client side challenge
Client Side Challenges
- Client hosted more than 3 different data vendors. (Geographic based)
- Organizing different data structures and data quality into a single uniform data (Core Challenge)
- Maintaining of too large datasets at monthly, yearly level.
- Traffic & Revenue reports was the predominant one for client, but too much delays on daily basis.
- Capturing and analyzing the revenue gaps was a challenge
- Revenue loss due to class discrepancy was un identified and difficult to analyse and predict.
Tools Used
- Microsoft SQL server.
- Oracle Server.
- AWS S3 ( Raw data storage), Glue ( Data Transformation) , Redshift ( Datamart Creation)
- Tableau server (BI Web interface), Tableau desktop. (BI preparation tool)
- Automatic dashboards updation on periodic intervals.
- APIs using Python
Team
- Project Manager, Business Analysts
- Senior Solution Architect
- Senior Data Warehouse Architect cum Designer
- ETL Developers and Data Ops Engineers
- Dashboard & Report Developers
- Data Scientist
- Data / Report Testers & Data Quality Analysts
Conclusion
- Data stored in Cloud after transformation to a common DataMart.
- Bypassing manual SQL process by AWS S3 storage and providing all time access to view raw data.
- Risk of data losing is prevented by secure data storage in S3 and layers of data transformation into various functional RDBMS.
- Simple & seamless DataMart creation in AWS Redshift of assorted data helped the client to view at one go.
- Live dashboards facilitated client to foresee the real business & take actions
- Models build to predict Traffic according to the weekends, holidays etc.
- Models build to predict possible revenue loss, prediction with related to road wear and tear to plan for laying roads.
- Dashboards to understand the class discrepancies and plan for solutions were implemented.
About the Client
Client caters to businesses of Personal Care as well as Food/Snacks, Beverages and Dairy segments. Client’s goal is to remain the preferred choice for customers at home and in every market, besides operating with conviction and leading certain chosen sectors for innovation. The company operates throughout India through a wide network of 25 lakh outlets and 1300 stockists.
Project Overview
To redesign their manual accounting & R&D system to automated Power BI ecosystem
Approach
Key results
- Deliverables : Accounts Receivables Dashboard, Cash collection Dashboard, Inventory holdings dashboards Models build to predict the growth of the branches .
- Converting traditional excel sheet to automation.
- Solving of crucial accounting formulas in DAX.
It was a pleasure working with Bilight team. They made the efforts to understand the journey of our business, suggested possible solutions and took us through every stage with utmost clarity. I strongly recommend them for any of the BI services.

Stay In Touch